Most Americans Can’t Afford New Homes
Most Americans can’t afford a new home.
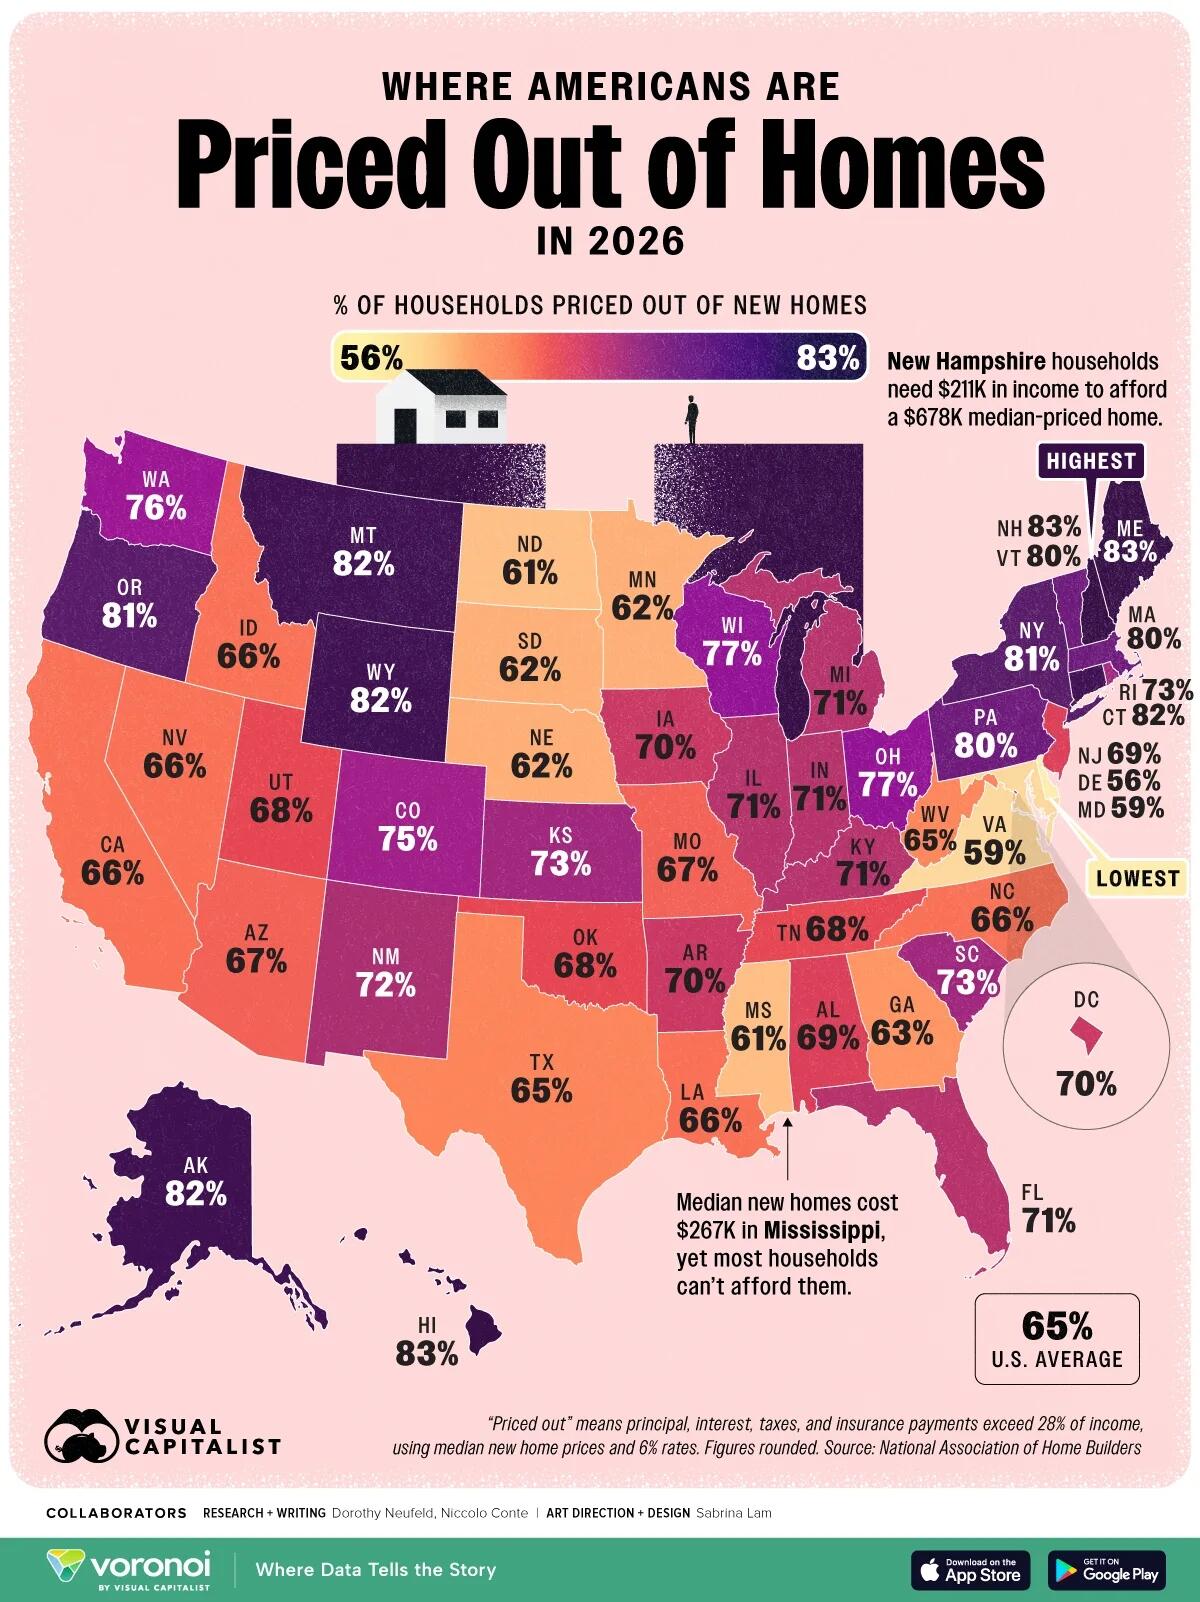
A new analysis from the National Association of Home Builders (NAHB) shows that 65% of U.S. households are priced out of newly built homes, based on current prices and mortgage rates.
In some parts of the country, the situation is even more extreme. More than 80% of households can’t afford a new home, highlighting how widespread the affordability gap has become.
This map, via Visual Capitalist’s Dorosthy Neufeld, shows where Americans are being priced out and where barriers to homeownership are highest.
Ranked: Where Americans Are Most Priced Out of New Homes
At the extreme end, buying a new home is nearly out of reach. In New Hampshire, 83.4% of households are priced out of a new median-priced home.
In total, 11 states have at least 80% of households locked out.
This table shows the share of households priced out of new homes by state in 2026. A household is considered “priced out” if total housing costs—principal, interest, taxes, and insurance—exceed 28% of income, based on median new home prices and a 6% mortgage rate.
State
% of Households
Priced Out of New Homes
Median New Home Price
Income Needed to Qualify
New Hampshire
83.4%
$677,982
$211,080
Hawaii
83.0%
$884,781
$234,818
Maine
82.7%
$548,493
$160,714
Alaska
82.2%
$627,077
$188,313
Connecticut
81.8%
$696,752
$224,811
Wyoming
81.8%
$580,627
$164,982
Montana
81.5%
$495,610
$141,997
Oregon
81.0%
$608,135
$173,717
New York
80.5%
$656,108
$204,163
Vermont
80.1%
$580,627
$181,064
Pennsylvania
80.0%
$528,370
$160,900
Massachusetts
79.8%
$836,236
$246,370
Wisconsin
77.3%
$485,449
$149,085
Ohio
76.5%
$443,646
$137,310
Washington
76.1%
$649,812
$185,213
Colorado
75.1%
$644,149
$179,928
Kansas
73.4%
$401,237
$128,372
Rhode Island
72.9%
$578,724
$174,451
South Carolina
72.5%
$421,098
$118,180
New Mexico
71.7%
$362,847
$104,055
Illinois
71.3%
$428,712
$143,374
Michigan
71.3%
$371,503
$122,158
Kentucky
71.3%
$398,741
$109,299
Florida
71.1%
$429,644
$127,139
Indiana
70.7%
$418,993
$123,219
District of Columbia
70.1%
$836,441
$232,260
Iowa
70.0%
$348,337
$120,598
Arkansas
70.0%
$381,881
$100,780
Alabama
69.2%
$375,944
$106,586
New Jersey
69.1%
$527,069
$172,356
Utah
68.2%
$531,151
$145,638
Tennessee
67.7%
$399,580
$111,631
Oklahoma
67.6%
$351,771
$107,846
Arizona
66.6%
$446,796
$122,364
Missouri
66.6%
$371,515
$111,332
Idaho
66.4%
$430,280
$117,615
North Carolina
66.4%
$394,058
$112,263
Louisiana
66.2%
$318,728
$95,895
California
65.6%
$545,892
$153,471
Nevada
65.5%
$420,782
$115,555
West Virginia
64.8%
$308,607
$88,071
Texas
64.5%
$369,798
$117,131
Georgia
62.5%
$374,579
$109,329
Minnesota
62.1%
$402,209
$122,025
Nebraska
62.0%
$328,603
$107,185
South Dakota
62.0%
$346,894
$106,233
North Dakota
61.4%
$382,451
$116,480
Mississippi
61.1%
$266,837
$80,174
Virginia
58.9%
$429,184
$122,542
Maryland
58.5%
$432,949
$127,559
Delaware
56.0%
$376,478
$104,282
While high-cost states like Hawaii and Massachusetts rank among the least affordable, others such as Maine and Wyoming show that affordability pressures are no longer limited to major metro areas.
Affordability Isn’t Just a Coastal Problem
The most striking takeaway is how universal the problem has become.
Even in lower-cost states like Mississippi ($267K) and West Virginia ($309K), a majority of households are still priced out new homes. While buyers need under $90,000 in income—compared to over $200,000 in the least affordable markets—that threshold remains out of reach for many.
In other words, moving to a cheaper state is no longer a reliable solution. Instead, the data points to a deeper issue, which is that incomes have not kept pace with rising housing costs across the country.
While existing homes can be more affordable than new construction, this data highlights a key constraint: much of the new housing supply entering the market is already out of reach for most households.
The Bigger Picture
As new home prices continue to outpace income growth, the gap between who can and can’t afford newly built homes is widening. That shift is reshaping where Americans live, how they build wealth, and whether homeownership is attainable at all.
If even the most affordable states are out of reach for most households looking at new homes, the question becomes harder to ignore: where can buyers realistically go next?
Learn More on the Voronoi App
To learn more about this topic, check out this graphic on where wealth is moving in America.
Tyler Durden
Sun, 05/17/2026 – 08:45
https://www.zerohedge.com/personal-finance/most-americans-cant-afford-new-homes